Graphs
Open source data visualization framework
Open online graphing tool
Diagram drawing
Easily draw diagrams online
E.g., for soil texture
Network analysis
Constructing and visualizing bibliometric networks
Social network analysis
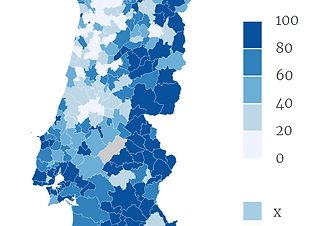
Draw colour maps
Plot statistical maps in seconds
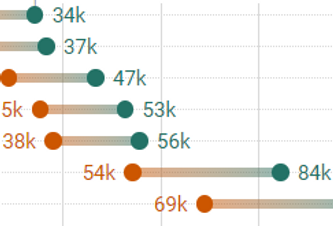
Make good looking graphs online
Many plots available online. Free to use the basic features, which are a lot, anyway.
ggplot2 manual 1
Explains how to use ggplot
Correlation Matrix and Heatmaps
Several statistical methods
Add-in for Excel
Add labels in graphs from any column with categorical data
Statistical software
Free version for academic students
Public domain map dataset
Check also the packages in R:
https://www.rdocumentation.org/packages/rnaturalearth/versions/0.1.0
https://cran.r-project.org/web/packages/rnaturalearthdata/index.html
Datawrapper helps you to publish your charts and maps in no time.
web tool for visualizing clustering of multivariate data
This web tool allows users to upload their own data and easily create Principal Component Analysis (PCA) plots and heatmaps.
ggplot2 manual 2
Graphs for the web and more
Build great images for your complex netwrok data
scatterplot3d
3D plotting made easy within R with a GUI
fitdistrplus
An R Package for Fitting Distributions
Satellite images of Earth
Check also NASA Worldview
Data visualization
Visualization and exploration software for all kinds of graphs and networks
Another good tool for making very good looking graphs online.
Make good looking graphs with R
R package that makes it easy to build interactive web apps straight from R
Visualize complex networks
Risk modeling - geospatial tool
Spatial Analysis and Decision Assistance tool. For spatial data analysis and modeling.
Text mining
Graphical Integrated Text Mining Solution
Satelite maps
Google gosur - radar, rain, wind
Edit pdf files
Edit pdf files in a photoshop-like environment
Modelling of natural variables
Excel add ins
R library for creating graphics, based on the The Grammar of Graphics
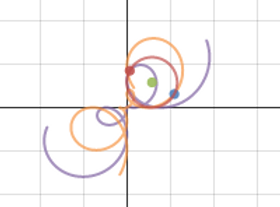
Draw function graphs online
ARGO for Excel add-in to run Monte Carlo Simulations - free
User-friendly and packed with good features - professional level.
DESMOS: Very fun site for making and playing with functions
XLRisk for Excel add-in to run Monte Carlo Simulations - free
MONTE CARLO SIMULATIONS in Excel
Free ad in
FREEWAT is an interface between QGIS and many data analysis and modelling tools, including MODFLOW and related models.
Freeware
General purpose statistical data-visualization system.
Has particular strengths, compared to other tools, for working with Categorical Data, Geographical Data and large data.
Free comprehensive Statistics package
Online too, for estimating sample size, or power of sample programmes.
Tool for connecting R with Excel. Free
Design presentations in minutes with our ready-made technology-themed templates you can customize to suit and topic.
Representative Values of Hydraulic Properties
Risk assessment tool using Monte Carlo Simulations and many other tools.
Basic tool is free
Free design templates for Powerpoint
Free add in
Video explaining how to code MCS in Excel
create Principal Component Analysis (PCA) plots and heatmaps
Distribution Fitting Free.
Statistical Analysis Handbook 2018 edition
Scientific plotting and graphing program
Simulate plastic drift in the oceans online
AI supported slide presentations
Hundreds of distinctive graphics made with R
Ngram Viewer: counting the number of times a keyword shows up in published books
How to do variogram modelling and kriging in R
HOME
TEACHING
COLLABORATORS
PUBLICATIONS
PROJECTS
COOPERATION
More